OLAP Data Cube - Calculated Measures Manager
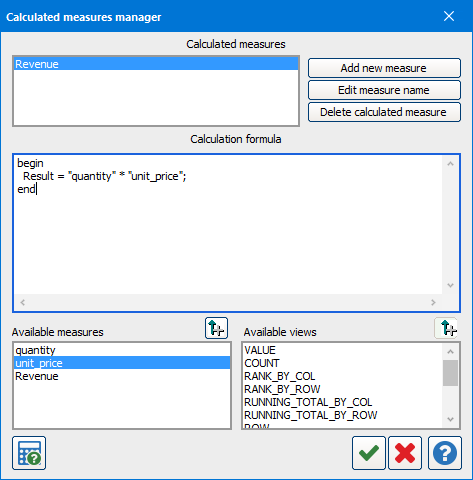
The calculated measures manager is used to add additional measures. Calculated measures are expressions that can have one or more selected measures.
The calculated measures manager can be called during design or run-time to create calculated measures.
- Calculated measures created during design are saved and are available any time a cube is run.
- Calculated measures created during cube run-time only exist for that session. When the cube is run again in the future, you will have to re-create that calculated measure.

- Calculated measures list - Lists all of the calculated measures that have been created. You can select the one you want to work with.
- Add new measure - Create a new measure to add to the OLAP data cube.
- Edit measure name - Edit the name of an existing calculated measure.
- Delete calculated measure - Immediately deletes the currently selected calculated measure.
- Calculation formula - The formula for the calculated measure is created here. The syntax is started for you and you can add to it using the available measures and available views from below. You can also edit directly in the formula by clicking on it.
You can use arithmetic operators (+, -, /, and *) to write your formula.
Below is an example formula. It assumes there is a measure named "Gift" and calculates the percentage of all gifts that each record makes up. You don't have to use all of the features that are in use here but this should give you a good idea of what the formula parser expects:
begin
var gift;
var giftTotal;
gift = "GiftAmt";
giftTotal = "GiftAmt"[COLUMN];
Result = gift / giftTotal * 100;
end; - Available measures - Lists the measures that are available for this OLAP data cube based how the cube was created.
- Available views - Lists the different type of views or types of calculations that are available for you to use in the calculation formula.
View Description VALUE The numerical value that is the result of aggregating the values from the data source. COUNT Count of the number of items. RANK_BY_COL All values in the column ranked by the size of the value. The largest value in the column is rank 1. RANK_BY_ROW All values in the row ranked by the size of the value. The largest value in the row is rank 1. RUNNING_TOTAL_BY_COL Vertical sum of values up to and including the current value. The last cell in the column will have the same value as the summary column. Note: The running total will make sense only for count-type measures such as Summa or Count. You may get strange results for statistical measures such as Min, Max, Average, etc. RUNNING_TOTAL_BY_ROW Horizontal sum of values up to and including the current value. The last cell in the row will have the same value as the summary row. Note: The running total will make sense only for count-type measures such as Summa or Count. You may get strange results for statistical measures such as Min, Max, Average, etc. ROW Total by row. COLUMN Total by column. PREV_BY_ROW Value in the previous row. PREV_BY_COLUMN Value in the previous column. NEXT_BY_ROW Value in the next row. NEXT_BY_COL Value in the next column.
| Icon | Description |
|---|---|
|
|
Check the formula for syntax errors. |
|
|
Accept changes and close screen. |
|
|
Cancel changes and close screen. |
|
|
Open In-Product Help. |
Need More Help?
If you need additional help creating OLAP cubes, refer to the Getting Started with OLAP Cubes page.